
Ukraine MOD Claims Audit
Open-source reliability assessmentData to 6 Nov 20261,716 daily reports tested

Can Ukraine's count of Russian losses be trusted?

Ten tests of the Russian-loss figure Ukraine publishes every day, using only data from outside Ukraine.

1,601,830Russian personnel losses claimed by Ukraine's General Staff6 Nov 2026 · killed, wounded & captured combined
286,000Russian military deaths confirmed by nameMediazona & BBC Russian · 6 Nov 2026 · a floor
1,709 / 1,716Daily figures rounded to the nearest ten and labelled "about"General Staff daily bulletins
−0.05Correlation between front-line rainfall and that day's claimed lossesSpearman ρ, 1,404 days, 2023–2026
Introduction

Why this matters

Ukraine's General Staff has published a running count of Russian losses every day since 24 February 2022. It now stands at 1.6 million. Newsrooms, think tanks and politicians repeat it as fact.

It is a wartime claim by one side, about the other side, released with no breakdown and no way to check it. That does not make it false. It does make it unsafe to build analysis on without testing it first.

This page puts the figure through ten tests: seasons, front size, weather, battles, doctrine and firepower, Russian recruitment, independent death counts, officials' own statements, the incentives behind the number and the drone footage it rests on. Every check uses data from outside Ukraine. The judgements below say how likely each conclusion is, using the scale UK Defence Intelligence uses for its own assessments.

Bottom line

Key judgements

The judgements below use the probability yardstick that UK Defence Intelligence uses in its own assessments, so each one states how likely it is, not only what we found.

  1. A

    It is highly likely that the daily figure is not a day-by-day measurement of Russian losses. It does not move with rain, snow, cold or a lagged day, and on the most variable test (wind) the effect is about 4%. Since mid-2024 none of 14 major battles, including Avdiivka's final assault, Kursk and Pokrovsk, pushed it outside an ordinary month's range. Using it for daily, weather or single-battle analysis builds conclusions on numbers that cannot carry them.

  2. B

    It is likely that the cumulative total is the right order of magnitude for killed plus wounded. It sits 3.1 to 4.8 times above Russian-sourced and CSIS death estimates at every matched date, which implies 2.1 to 3.8 wounded per death, inside the normal historical range. Western estimates that match it almost exactly are mostly an echo, because they draw on Ukrainian data. The fully independent check, deaths from Russia's own registries, is consistent with anything from about 1.15 to 1.6 million today, depending on how many video-claimed drone hits were real (Test 10).

  3. C

    It is a realistic possibility that figures since mid-2026 are inflated. Claimed losses reached records while ISW shows Russia gaining about 80 km² net in ten months. The defence ministry's own video-verified drone count stayed flat at about 30,000 a month while the published total rose to 54,200, and October became the first month to clear the 50,000 target set in January. Against this, a NATO official put September's Russian losses even higher than the General Staff did.

  4. D

    It is almost certain that comparing 1.6 million to Mediazona's 286,000 as like for like is an error, in either direction. One counts casualties, the other counts named dead, and the gap between them is mostly the wounded.

TestWhat the data showsReliability signal
1 · SeasonsNo dip in the spring and autumn mud seasons. Since 2024, day-to-day variation drops by more than half every summer.Caution
2 · Front sizeSome smoothness is expected across a 1,200 km front. Summer smoothness only fits if nothing front-wide moves losses.Caution
2 · IntensityNo link to how much ground Russia took per ISW in 2024–25 (ρ = 0.00). In 2026 claims hit records while ISW shows Russia losing ground.Red flag
3 · WeatherNo measurable link to rain, snow or temperature on the day or the day after.Red flag (daily use)
4 · Key battlesUntil mid-2024 the figure jumped around big battles. Since then none of 14 major battles moved it beyond an ordinary month's range.Red flag (since 2024)
5 · Doctrine & firepowerThe 2025 dip and 2026 rise have military explanations (infiltration tactics, a wider drone kill zone). Flat battle response and the unverified 2026 increment do not.Caution
6 · RecruitmentClaims roughly matched recruitment in 2024–25, then ran ahead of it in 2026.Caution
7 · Independent countsA stable multiple of Russian-sourced death estimates. CSIS matches the total to within 1%, which may not be fully independent.Holds up (totals)
8 · Officials' statementsWhole-war totals just repeat the General Staff figure. Battle claims run 1.3–1.7× outside estimates, and in 2026 the video-verified drone count stopped rising while the total kept climbing.Red flag
9 · IncentivesA public 50,000-a-month target and a points-for-kills system now sit upstream of the figure.Red flag
10 · Footage verificationSince 2025 about three-quarters of the figure rests on drone footage that ends at impact, verified only inside Ukraine's own systems. At RUSI's 50% hit rate the total would be about 1.15M, and Russian death records could not tell the difference.Red flag (unaudited)
Cross-referenceWestern casualty totals now match the MOD within 1%, but mostly because they use its data. Only death counts from Russian registries are fully independent.Echo chamber
Test 1The official series

The whole series, and season by season

The General Staff figure has risen in three steps: about 200 a day in mid-2022, 600–1,000 through 2023, and 1,000–1,500 from 2024. In 2026 it climbed again, averaging 1,750 a day in October and 2,277 a day in early November, the highest sustained level of the war. Fighting in Ukraine is known to follow the ground. Mud in spring (rasputitsa) and late autumn slows armour and assaults, and summer and frozen winter ground favour them.

Russian personnel losses claimed per day

Daily figure30-day average

Source: General Staff of the Armed Forces of Ukraine daily bulletins, compiled by P. Ivaniuk. Daily figure is the change in the cumulative total. Hover for values.

Average claimed losses per day, by season

Small figure: day-to-day variation (coefficient of variation)

Meteorological seasons. December counts toward the following winter. 2022 starts on 25 February; autumn 2026 runs to 6 November.

Assessment The season changes how steady the number is, not how big it is.

Spring mud never produces the lowest season. Since 2024, summers have been twice as steady as winters (7.5% daily variation against 18%), the opposite of what bursty summer fighting should produce.

Test 2Front-line size and intensity

How consistent should the numbers be on a 1,200 km front?

No source outside Ukraine publishes a measured length for the active front. Ukraine's command gives 1,200–1,250 km (reported by AP, September 2025, unverified). Independent analysts' maps give about 1,000–1,100 km. The model below works with any figure in that range, and the answer barely changes across it. A long front works against the "too consistent" argument. A daily total built from hundreds of separate sectors should be fairly smooth, in the same way a national daily birth count is smoother than one hospital's. The real question is how smooth. The model below adds up independent sectors and lets you set how clustered the losses are and how much front-wide events (weather, big offensives) move them.

What day-to-day variation should we expect?

Independent maps ~1,000–1,100 km; Ukraine's command claims 1,200–1,250 km
Roughly a brigade's frontage
Low = a few mass assaults dominate. High = a steady trickle from drones and artillery.
Shared shocks that hit every sector at once: weather, offensives, rotations
–expected day-to-day variation

Model: daily total = sum of N = front ÷ sector independent negative-binomial counts, times a shared lognormal daily shock. Coefficient of variation ≈ √(1/μ + 1/(N·k) + σ²). Observed values use the daily figure divided by its centred 29-day median, 2023–2026, so long-run trends do not count as variation.

Claimed losses against ground changing hands, 2024–2026

Claimed Russian lossesISW, via AFP monthly analysisDeepState (Ukrainian, shown for comparison)

ISW: AFP's monthly analyses of Institute for the Study of War maps. AFP reported gross Russian advances through early 2025 and net change after that, and excludes infiltration zones. "?" marks months AFP did not report (Feb–Apr 2024). September 2026 is ISW's own net figure. AFP's figures for January and May–July 2024, and ISW's September 2026 figure, were found only as relayed by Ukrainian outlets. DeepState: net monthly change computed by visua.no (CC BY 4.0). 2023 is left out because AFP did not publish monthly figures that year.

Assessment Smoothness is expected. Ignoring the battlefield is not.

A 1,100 km front explains about 15% day-to-day variation, but not summer's 7.5%. Monthly claims show no link to ISW's map changes in 2024–25 (ρ = 0.00). In 2026 they hit records while Russia gained about 80 km² net. Russia kept attacking elsewhere and drones hit defenders too, so lost ground alone does not prove inflation.

Test 3Weather

Does the weather move the number?

Daily weather comes from five front-line towns (Pokrovsk, Bakhmut, Kupiansk, Orikhiv and Kherson) via the Open-Meteo historical archive. Each day's claim is compared with its own 29-day median, so the test looks only at day-to-day movement. Bars show how far above or below a typical day the claim sits in each weather band, with 95% confidence intervals.

Rainfall

Snowfall

Mean temperature

Maximum wind speed

Correlation with the detrended daily claim (Spearman ρ, n = 1,404): rainfall −0.05, snowfall −0.08, temperature −0.02, cloud cover +0.04, wind −0.12. Rain against the next day's claim: −0.003, so a reporting lag does not hide the effect.

Assessment Weather does not move the daily number.

Rain, snow and frost have no measurable effect. Wind, which grounds drones, shifts it by about 4%. The daily figure cannot support day-level analysis.

Test 4Key battles

Do the big battles show up in the count?

A real casualty count should jump when a set-piece battle peaks, and dip when a truce holds. Battle dates come from ISW, CNN, Al Jazeera, AFP, Meduza and other sources outside Ukraine. For each battle's most intense phase, the claimed daily average is compared with the six weeks before it, then ranked against every other stretch of the same length since June 2022.

Claimed daily losses with battle peaks marked

Russian offensiveUkrainian offensive30-day average

Shaded bands mark each battle's peak phase. Hover a band for the battle. Numbers match the chart below.

Change in claimed losses during each battle's peak, vs the six weeks before

Grey band: the middle 80% of changes seen across all stretches of the same length since June 2022, so a bar inside it is ordinary. Bars are ordered by date. Hover for the averages and the percentile.

Truces: did claimed losses fall?

Every truce was reported as violated by both sides, so a full drop is not expected. A real count should still dip.

Assessment Since mid-2024, battles no longer show up in the count.

Before August 2024, 5 of 10 battles pushed claims into the top 10% of all periods. Since then none of 14 has, including Avdiivka, Kursk and Pokrovsk. Most truces left it flat too.

Test 5Doctrine and firepower

Does the count follow who has the guns, and who is attacking?

Two military explanations could make an honest count look strange. Firepower: Russian losses should rise when Ukraine's ability to kill rises. That ability went from a shell shortage in early 2024 to drone dominance in 2025–26. Posture: the old rule that attackers lose more is weaker than it sounds. Across hundreds of historical battles, the Dupuy Institute found attackers' losses are on average similar to defenders'. Only failed attacks cost the attacker clearly more, about 1.7 to 1. The famous 3:1 rule is about how many troops an attack needs, not about who loses more.

Claimed losses across the war's firepower periods

Claimed per day, 30-day average

Period boundaries and firepower figures: RUSI and Open Source Centre, CNN citing US and NATO officials, Estonian defence intelligence, Sky News citing Western officials, NYT, Latvian intelligence (SAB), CSIS. No source outside Ukraine gives artillery fire rates for 2025–26.

Ground taken vs claimed losses, by year

202420252026

Each dot is a month. Lines are each year's trend. ρ: 2024 +0.77, 2025 −0.62, 2026 −0.37.

Battle effect by who was attacking

Each dot is one battle from Test 4. Black tick: median.

Assessment Doctrine explains the trend. It does not explain the blind spots.

The 2025 dip fits Russia's switch to 2–5-man infiltration groups, which exposed fewer men while taking more ground. The 2026 rise fits a drone kill zone that RUSI puts 30 km deep, which hits defenders as hard as attackers. Neither explains a count that stopped reacting to battles in 2024, or a 2026 rise that sits entirely outside the video-verified data. RUSI found that only about half of Ukraine's publicly claimed drone kills of Russian artillery were real destructions.

Test 6Recruitment and mobilisation

Can Russia replace what Ukraine says it loses?

Russia mobilised 300,000 reservists in autumn 2022 and has relied on paid contract recruitment since. Official figures come from Dmitry Medvedev and the defence ministry. Independent estimates come from regional enlistment-bonus spending (Janis Kluge, SWP; iStories). Vladimir Putin has put the Russian force in the war zone at 617,000 (December 2023), almost 700,000 (June 2024), 700,000 (September and December 2025) and more than 700,000 (June 2026). Since mid-2024, then, Russia's own figure has the force roughly flat.

Per month: losses Ukraine claims vs soldiers Russia recruits

Claimed Russian lossesRecruits, official Russian figureRecruits, independent estimate range

2026 claims run January to October. 2026 official recruits: 127,000 contract plus 10,000 volunteers in January–April (Medvedev). Independent 2026: 71,216 in Q1 (Kluge, federal budget) to ~30,000 a month in Q2; CSIS puts 2026 recruitment from all sources at about 27,000 a month. 2023 has no independent estimate; the official 540,000 includes soldiers re-signing existing contracts.

Show data table
Assessment Claims matched Russian recruitment until 2026.

In 2024–25, claims of about 35,000 a month matched recruitment. In 2026 they average 38,000 and hit 54,200, against 24,000–30,000 recruits a month and a force Putin says held at about 700,000.

Test 7Independent counts

Cross-checking against Mediazona and Meduza

Mediazona and BBC Russian confirm deaths one name at a time from obituaries, social media and leaked registries. It is a hard floor, and it lags by months. Separately, Mediazona and Meduza estimate total deaths from Russia's probate registry, which shows excess deaths among men of fighting age. Neither counts the wounded. Ukraine's figure does.

Cumulative Russian losses: claimed casualties vs independent death counts

Ukraine General Staff (casualties)Meduza/Mediazona probate estimate (deaths)Mediazona named deaths (floor)CSIS estimate

The end-2025 probate estimate (352,000) adds 90,000 deaths recognised by courts or registered at least 180 days late; the standard-registration figure is 261,000. CSIS: about 1.2 million casualties and up to 325,000 deaths to December 2025 (January 2026 report); about 1.4 million casualties and up to 450,000 deaths to June 2026 (July 2026 report).

The ratio at matched dates

Implied wounded per death assumes the General Staff figure is killed plus wounded, and ignores the small number captured. Historical wars typically run 2.5 to 4 wounded per death. Some analysts argue drone warfare pushes the ratio lower.

Assessment Against the right comparison, the total holds up.

Ukraine's figure stays 3.4–4.8 times Russian-sourced death estimates, a normal ratio for killed plus wounded. 1.6 million is casualties, not deaths, and 286,000 is a floor, not the toll. CSIS matches the total to within 1%, which may reflect shared inputs.

Test 8Officials' statements

What officials said against what was published

Ukrainian commanders and ministers regularly give their own figures for Russian losses, for a single battle, a month or a year. These statements are the thing being tested, so they come from Ukrainian officials by definition. Each is checked two ways: against the General Staff's own daily totals for the same dates, and against figures for the same battle from governments and researchers outside Ukraine.

2026: the defence ministry's video-verified drone count vs the General Staff total

General Staff, all causesMinistry of Defence, drone hits verified on videoFedorov / Zelensky monthly "verified" figure

Ministry of Defence drone series published 27 Oct 2026 (October covers 1–25 October, compared with the General Staff total for the same 25 days). Fedorov and Zelensky gave separate monthly "verified" figures for March (35,351), April (35,203) and May (31,530). Ukraine's officials said drones caused 96% of Russian casualties in March, as reported by Al Jazeera.

Single-battle claims as a share of everything claimed nationwide over the same dates

Killed and woundedKilled only

Hover for the statement, its dates and the nationwide General Staff total for the same period.

Same battle, outside figure

Assessment Officials echo the total. Their battle and drone figures do not add up.

Whole-war statements match the series to within 2%: the same number, not confirmation. Battle claims run 1.3–1.7 times US and UK estimates. In 2026 the ministry's video-verified drone count held at about 30,000 a month while the published total rose to 54,200.

Test 9Incentives

What happens when the number becomes a target

In January 2026 Ukraine's defence minister Mykhailo Fedorov named 50,000 Russian casualties a month a strategic goal, as reported by Business Insider and Al Jazeera. Under a points system, drone units earn credits, spent on new equipment, for each kill confirmed on video. Video confirmation is a real safeguard. A public target plus a reward for each counted kill is still the textbook setting for Goodhart's law: a measure that becomes a target stops being a good measure.

Claimed Russian losses per month, 2025–2026

Month totalNovember 2026 at its current daily pace

November 2026 covers 1–6 November (13,660), projected at 2,277 a day, about 68,000 for the month. The General Staff total covers all causes; the drone-unit points count is a subset of it.

Assessment The series cleared its new target in the first month it plausibly could.

First-half 2026 claims (32,600 a month) match CSIS's 30,000–34,000. From July they average 46,000, and no outside source covers those months yet. Treat them as claims, not findings.

Test 10Footage verification

What if a share of the video-confirmed hits weren't hits?

Since 2025, most of the figure rests on drone footage. Outside sources put drones behind 70–80% of casualties, and Ukraine's own video-verified drone count equals 63–107% of the monthly total in 2026. An FPV drone's video ends when its camera dies. That happens on a direct hit, but also when the drone strikes the ground a few metres short, is jammed in the last seconds, or the target dives clear. From the strike drone's own feed you cannot tell these apart, or tell killed from wounded. Only a second camera watching the aftermath settles it.

Ukraine's defence ministry says every counted strike is verified on video inside its own systems. It has not published the standard, and no outside party audits it. The one outside measurement comes from RUSI, which found that only about half of Ukraine's publicly claimed drone kills of Russian artillery were real destructions.

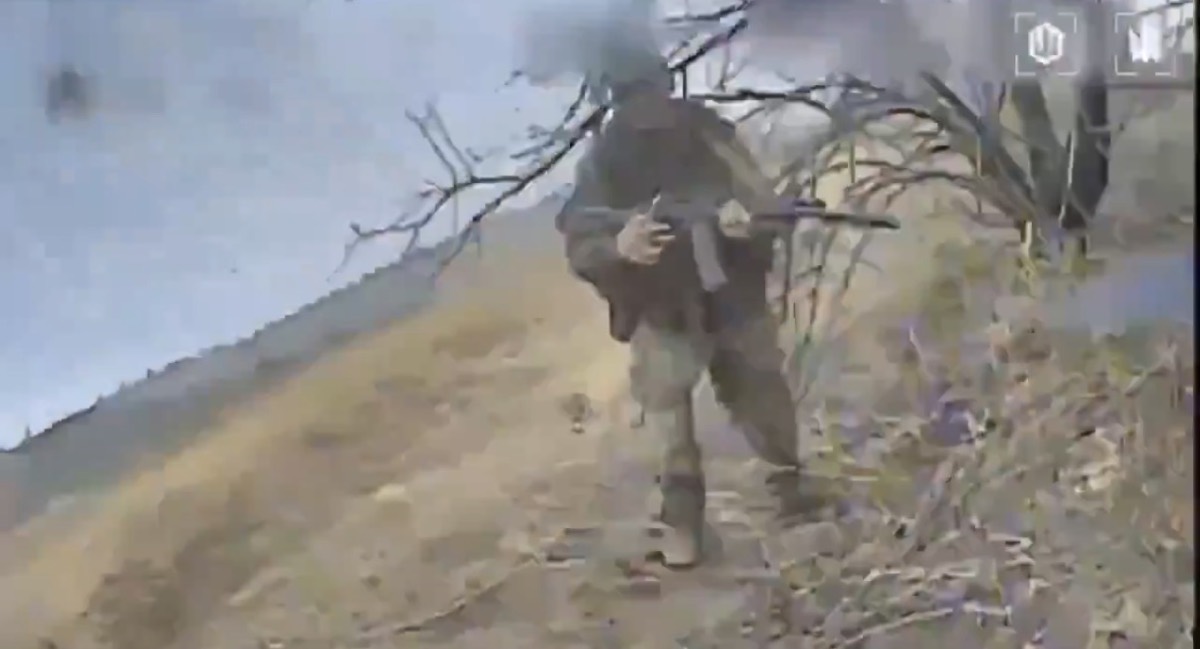
Example: the last two frames of a published strike clip, a clear hit

FPV drone view of a soldier carrying a rifle along a treeline, a few metres ahead of the droneFrame 1. Final approach. The target is a few metres away and still moving.
The drone at point-blank range on the soldier, his camouflage filling the frame as the video breaks upFrame 2. A clear hit. The drone reaches the soldier and his camouflage fills the frame as the link breaks up.
Stills from a strike video published by a Ukrainian drone unit (unit logos top right). Under the audit protocol below, this clip is coded B: the strike reached its target. What no FPV clip can show on its own is the outcome, whether the soldier was killed or wounded, because the camera dies on impact. Clips that end with the target still metres away are code C.

Set how many video-claimed drone hits were real casualties

100% = take the footage at face value. RUSI's artillery finding ≈ 50%.
Latvian intelligence and Russian military medics: 70–80%. Ukraine's own claim: 96%. Earlier years are fixed: 5% (2022), 20% (2023), rising through 2024.
–Russian casualties today, adjusted
Check 1 · Russia's own death records

Check 2 · Russian recruitment

Claimed and adjusted totals against Russian death records

Claimed (Ukraine MOD)Adjusted for your hit rateDeaths, Russian probate recordsMinimum casualties those deaths imply (×2.3 to ×3.3)

The shaded band multiplies each probate death estimate by 2.3–3.3 (1.3–2.3 wounded per death, the low end of published ratios for a drone war). An adjusted line inside or below the band is hard to square with Russia's own death records. Probate deaths: Mediazona/Meduza.

Audit protocol: measure the hit rate yourself

Sample strike videos posted by Ukrainian unit channels and code every strike once. The share of A and B gives a measured hit rate to put in the slider. Published clips are each unit's best footage, so the result is an upper bound.

CodeWhat the clip showsCounts as
AA second camera shows the aftermath: the person down, not moving, or being evacuatedConfirmed casualty
BThe strike feed shows detonation on or within about 1 m of the person; no aftermath shownProbable casualty (count as half)
CFeed ends on final approach with the target still moving or more than about 2 m awayUnconfirmed
DFeed breaks up early (jamming) or the drone crashes before reaching the targetMiss
ESame person, place and time as another clip already codedDuplicate (exclude)

Also record the unit, date, sector, drone type, the distance to the target in the last clear frame, and how many drones struck the same target. Hit rate ≈ (A + 0.5 × B) ÷ (A + B + C + D).

Assessment The total is only as good as footage nobody outside Ukraine audits.

If half the video-claimed drone hits were real casualties, the rate RUSI found for artillery, Russian losses today would be about 1.15 million, not 1.6 million. Russia's own death records could not tell the difference: the ratio of wounded to dead would still be believable in a drone war. Russia's death records only rule out hit rates below about 30%. Treat the total as a range of about 1.15–1.6 million.

For analysts

Where the confirmation bias actually sits

Quote it as a claim, with its definition

"Ukraine's General Staff says Russia has lost about 1.6 million personnel killed, wounded or captured." Not "Russia has lost 1.6 million soldiers."

Never analyse the daily number

It is rounded, smoothed and blind to weather. Daily spikes and dips say more about reporting than about battles. Use monthly totals at the finest.

Trace every number to its source

A Western or think-tank total that matches Ukraine's may simply be Ukraine's. Ask where an estimate gets its data before counting it as confirmation.

Compare like with like

Casualties go against casualties (CSIS, UK Defence Intelligence). Deaths go against deaths (Mediazona, Meduza). Mixing them manufactures either a massacre or a cover-up.

Treat the latest six months as provisional

Independent counts lag. The months with no outside check are the months where incentives now act most strongly on the figure.

Check it against the map

Real losses should track real fighting. When claimed losses and ground changing hands move apart, ask why before quoting.

Hold the sceptical case to the same standard

The Ukrainian total has matched independent casualty estimates for three years. "Ukraine inflates everything" is as much a confirmation bias as "Ukraine's numbers are fact."

Cross-reference

How the Ukrainian figure compares with everyone else's

Russian losses are estimated by three kinds of source: governments and institutions that back Ukraine, independent researchers, and Russia itself. Each estimate below is set against the Ukrainian MOD's running total on the same day. Casualty estimates and death estimates are kept on separate charts, because mixing them is the most common error in this debate.

Casualty estimates (killed and wounded)

Ukraine MODWestern / pro-UkrainianIndependentRussian / pro-Russian

Death estimates

Ukraine MOD total ÷ 3 to ÷ 4 (what it implies at 2–3 wounded per death)Named-death floor

Ranges are plotted at their midpoint; hover for the range. The Russian MoD's only official figures (1,351 in March 2022, 5,937 in September 2022) sit on the baseline.

The echo chamber: where each estimate gets its numbers

Uses Ukraine's figure directly
  • UK Defence Intelligence builds its daily and annual Russian casualty rates on Ukrainian General Staff data.
  • UK Chief of Defence Staff (Sep 2026): his "1.5 million" was Ukraine's own total, quoted as a British figure.
  • ISW casualty-per-km² figures divide Ukraine's claims by ISW's map.
  • Officials' statements (Test 8) read out the same series.
Built partly on estimates that use it
  • CSIS compiles US and UK government estimates with satellite imagery. Its totals match Ukraine's to within 1% at three dates.
  • NATO briefings give no method. Their totals move in step with Ukraine's.
Built without it
  • Mediazona / BBC Russian named deaths, checked one by one.
  • Probate and mortality records from Russia's own registries (Mediazona, Meduza, Kobak).
  • Russian state budget, Prigozhin and war bloggers.
  • Early US and UK estimates (2022–23), which ran 15–55% above Ukraine's figure.

The timing tells the story. Western casualty totals were independent and higher than Ukraine's in 2022–23. They converged on it exactly once UK Defence Intelligence began reporting Ukraine's daily data. Every source built entirely outside the loop counts deaths, not wounded, so none can confirm or refute the total on its own.

Western / pro-Ukrainian

UK, US, NATO, France, IISS, CSIS

92–155% of the MOD figure in 2022–23 · 96–104% since 2025

How it fares: early Western totals ran well above Ukraine's. They converged on it from 2024 and now match it almost exactly. Their death estimates (300,000–500,000) imply 2–4 wounded per death against the MOD total.

Why it's trusted: intelligence access (intercepts, imagery, liaison) and regular dated totals that split out deaths.

Watch for: the echo. UK Defence Intelligence builds its daily rates on Ukrainian data, and the UK defence chief's 1.5 million was Ukraine's own number. CSIS and NATO build on these. Agreement since 2025 is largely circular, and many figures come from anonymous briefings with no method.

Use it for early-war totals and death estimates.

Independent

Mediazona, BBC Russian, Meduza, demographers

Deaths only · MOD is 3.4–4.8× their death estimates

How it fares: no independent source estimates casualties, only deaths. Death counts from Russia's own registries sit at a steady fraction of the MOD total, a normal ratio for killed plus wounded.

Why it's trusted: names that can be checked one by one, Russia's own probate and mortality records, and published methods.

Watch for: the named list is a lagging floor that jumps when leaks are processed. Probate data runs six months or more behind and misses occupied-territory fighters and foreigners.

Use it for deaths, and as the only check built outside both governments.

Russian / pro-Russian

Russian MoD, Kremlin, Prigozhin, war bloggers, state budget

Official deaths: MOD figure 9–12× higher · FSB internal count 74% of MOD (2023)

How it fares: the last official figure was 5,937 dead in September 2022, frozen since. Russia's own internal signals point far higher: the 2024 budget funded survivor pensions for about 100,000 war dead, Prigozhin admitted 20,000 Wagner dead at Bakhmut alone, and an FSB count leaked in 2023 put casualties at 110,000.

Why it's trusted: Russia holds the actual records, and insiders saw specific battles first-hand. Budget and pension data are hard to fake at scale.

Watch for: official figures are deliberately suppressed. Insiders had feuds to settle. The FSB count reached the public through leaked US documents and is unverified. Purported Russian documents released by Ukrainian intelligence are excluded from this page.

Use it for single-battle checks (Bakhmut, Avdiivka) and budget-based floors. Never for totals.

Show all estimates

† Found only through a Ukrainian outlet relaying a non-Ukrainian source.

Assessment The figure looks like a consensus because much of the consensus is the figure.

Since 2025 the main Western casualty totals either use Ukraine's data directly or build on estimates that do, which is why they match it to within 1%. Those totals are an echo, not a confirmation. The only casualty totals built without it, the 2022–23 US and UK estimates, ran higher than Ukraine's. Sources fully outside the loop count deaths only: 285,000 named, and 352,000 from Russia's probate records to end-2025.

Method

Data and sources

All statistics were computed from the raw series: 1,716 daily General Staff figures (24 Feb 2022 – 6 Nov 2026), Open-Meteo daily weather averaged over five front-line towns, and AFP's monthly analyses of ISW maps (2024–2026). The General Staff series and officials' statements are the subject under test, so they are necessarily Ukrainian. Every other input comes from outside Ukraine; DeepState appears only as a comparison. Purported Russian documents released by Ukrainian intelligence (an alleged Kremlin loss assessment, March 2026, and an alleged Russian loss sheet, October 2025) are excluded, because their provenance runs through a party to the war. Daily tests use 2023 onward, after the war of movement ended. Correlations are Spearman rank correlations. Recruitment, death and battle figures are as published by their sources and carry their sources' uncertainty.

  1. Subject under test General Staff of the Armed Forces of Ukraine, daily bulletins, compiled at PetroIvaniuk/2022-Ukraine-Russia-War-Dataset
  2. Subject under test Ministry of Defence of Ukraine: drone casualties by month, 2026
  3. Weather Open-Meteo historical weather archive
  4. Territory AFP/ISW via Moscow Times: Oct–Nov 2024
  5. Territory AFP/ISW via Arab News: Dec 2024 – Feb 2025
  6. Territory AFP/ISW via Fakti/BTA: Apr–Jul 2025
  7. Territory AFP/ISW via Moscow Times: 2025 year-end
  8. Territory AFP/ISW via Free Malaysia Today: Jan–Mar 2026
  9. Territory AFP/ISW via Moscow Times: April 2026
  10. Territory AFP/ISW via Euronews: June 2026
  11. Territory AFP/ISW via France 24: October 2026
  12. Comparison only DeepState via visua.no
  13. Battles ISW assessments (criticalthreats.org): Pokrovsk
  14. Battles Al Jazeera: Avdiivka
  15. Battles CNN: Pokrovsk claim
  16. Battles Meduza: Kursk
  17. Battles Euronews: Operation Vivaldi
  18. Truces Al Jazeera: May 2026 ceasefire
  19. Deaths Mediazona: updated count, 23 Oct 2026
  20. Deaths Mediazona & Meduza: 352,000 estimate
  21. Deaths Meduza: the deadliest year yet
  22. Deaths Mediazona & Meduza: 75,000 by end of 2023
  23. Deaths Mediazona & Meduza: 47,000 by mid-2023
  24. Deaths Moscow Times: 150,000 named
  25. Deaths Meduza: Wagner losses at Bakhmut
  26. Casualties ABC News/AP on CSIS: 1.2 million to Dec 2025
  27. Casualties CSIS via ecoi.net: Russian Blood and Treasure, Jul 2026
  28. Casualties Meduza on UK MoD: Bakhmut
  29. Casualties The Insider: US intelligence and BBC Russian on Avdiivka
  30. Casualties Meduza: Murz on Avdiivka
  31. Casualties Euronews: South Korea NIS on North Korean dead
  32. Casualties Yahoo/Bloomberg: NATO official, September 2026
  33. Casualties Yahoo/Bloomberg: Western officials, Dec 2025 – Jan 2026
  34. Statements Reuters via Yahoo: Zelensky on Bakhmut
  35. Statements Telegraph via Yahoo: Lykhovyi on Avdiivka
  36. Statements Euronews: Shtupun on Avdiivka
  37. Statements Reuters via The Star: Zelensky on Kursk
  38. Statements Washington Post: Syrskyi on Kursk
  39. Statements The Defense Post: October 2026
  40. Statements Al Jazeera: March 2026, drones 96%
  41. Statements Business Insider: Fedorov's 50,000 target
  42. Recruitment Moscow Times: Medvedev 2025
  43. Recruitment TASS: ~450,000 in 2024
  44. Recruitment iStories: up to 407,000 in 2024
  45. Recruitment Janis Kluge: Q1 2026
  46. Recruitment Reuters via Yahoo: 127,000 in 2026
  47. Force size TASS: Putin: over 700,000
  48. Force size Reuters via Yahoo: Putin: nearly 700,000 (2024)
  49. Front length AP via Yahoo: citing Ukraine's command
  50. Method UK PHIA probability yardstick
  51. Firepower RUSI: Tactical developments in the third year (Feb 2025)
  52. Firepower RUSI: Emergent approaches to combined arms manoeuvre (Oct 2025)
  53. Firepower CNN via KVIA: Russian artillery fire down 75% (Jan 2023)
  54. Firepower ERR: Estonian intelligence on Russian fire rates
  55. Firepower CNN: 5:1 shell ratio (Mar 2024)
  56. Firepower Business Insider via Yahoo: ratio narrows to 1.5:1 (Dec 2024)
  57. Firepower NYT via NZ Herald: drones become the main killer (Mar 2025)
  58. Firepower iStories: Russian military medics: >75% of injuries from drones
  59. Firepower Politico via Azvision: Latvian intelligence: drones cause 70–80% of casualties
  60. Firepower CNN via KEYT: CSIS: exchange ratio ~8:1 in H1 2026
  61. Doctrine Dupuy Institute: combat attrition verities
  62. Doctrine Dupuy Institute: force ratios vs casualty exchange ratios
  63. Doctrine Dupuy Institute: loss exchange by battle outcome
  64. Doctrine War on the Rocks: Kofman & Evans, Apr 2026
  65. Doctrine AP via ADN: drone kill zone delays evacuation